何を学べるか。 混合原価分析の主要な要素をまとめる
混合原価は、いくつかの固定費要素とともに、いくつかの変動費要素を含んでいます。 ここでは、混合原価を定義し、このタイプの原価を分析するためのさまざまな方法を見ていきます。 このユニットでは、小売業と製造業の両方の施設について見ていきます。
学習成果
- 小売業と製造業における混合費用の定義と例を概説する
- 従属変数と独立変数を定義する
- 混合費用をハイブリッドコストと呼ばれる方法で分析する
- 混合費用の定義と例を概説する
- 混合費用を分析する。
- 最小二乗回帰法を使用して、コスト データのグラフに回帰線を作成する
混合コスト
混合コストとは、固定コストと変動コストの両方の要素を持つコストのことを指します。 グラフにすると、混合コストは次のようになります。
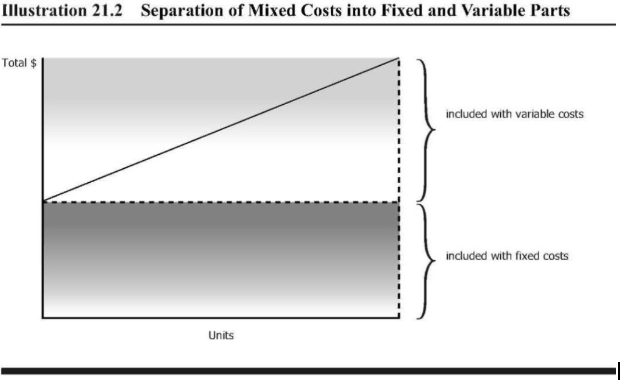
最初の 1,000 個のウィジェットに対して基本料金が 500 ドルであり、1,000 個以上のウィジェットを販売するたびに、さらに 1 ドルを支払う必要があると仮定します。 変動費は、ウィジェット1個あたり1ドルです。
混合コストの方程式は次のようになります。
Y= 混合コストの合計
a= 固定コストの合計
b= 活動単位あたりの変動コスト (上の線の傾き)
X= 活動レベルです。
変動線の傾きが急であればあるほど、単位当たりの変動コストは高くなります。
小売環境では、何が混合コストとなり得るでしょうか。 家賃は混合コストになる可能性があります。 リースの状況によっては、基本の家賃があり、さらに売上の何パーセントかが上乗せされることがあります。 例えば、地元のショッピングモールに小さな小売店のスペースを借りたとしましょう。 あなたは、月額500ドルの基本的な家賃と、売上高の2%を請求されています。 この費用の固定部分は、売上がゼロであってもその金額を支払うので、500ドルです。 この費用の変動部分は、売上の2%になります。 売上が1ドル上がるごとに、家賃が0.02ドル加算されます。
練習問題
独立変数と従属変数
ここでは、混合費用の概要と、費用の動作の理論をテストするための散布図を作成します
あなたは地元の犬の手入れ屋のメンテナンス担当者です。 It is budget time, and you are working on your maintenance budget for the year. In an effort to work through your numbers, you notice that the maintenance cost has a fixed component to it. The hypothesis is that for each additional dog groomed, there is additional maintenance cost incurred. Let’s look at a few months worth of activity:
| Month | Number of Dogs Groomed | Total Maintenance Cost |
|---|---|---|
| July | 560 | 790 |
| August | 710 | 850 |
| September | 500 | 740 |
| October | 650 | 820 |
| November | 730 | 910 |
| December | 800 | 980 |
Going back to our mixed cost formula:
Y= total maintenance cost and will be plotted on the vertical axis of our graph. This cost is the dependent variable since the amount depends on the activity for the period.
X= the activity or number of dogs groomed. This will be plotted on the horizontal axis and is the independent variable, because it is the factor that causes the variations in the cost.
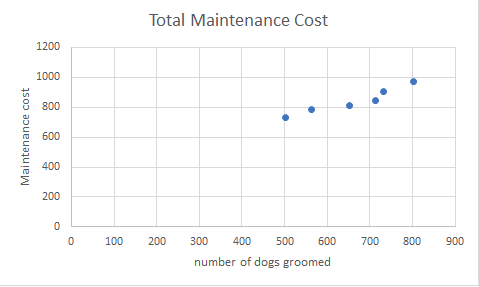
つまり、このグラフから、グルーミングされた犬の数が多ければ多いほど、メンテナンス コストが高くなり、それもある程度直線的に上昇していることがわかります。
練習問題
ハイロー法
前の犬のグルーミングの例では、メンテナンス コストがグルーミングした犬の数に関連していることが散布図を通して明確にわかりました。
上の散布図は、メンテナンス コスト (コスト -Y) とグルーミングされた犬の数 (アクティビティ -X) の間に比較的直線的な関係があることを示しています。 7.2.2 の図に戻ると、最も低い月では 500 頭の犬が手入れされ、維持費は 740 ドルでした。 一方、最も多い月は800頭の犬をグルーミングし、維持費は980ドルでした。 では、この数字をハイ・ローの式に当てはめてみましょう。
変動コスト = 高いアクティビティ レベルでのコストcost at the low level of activity
High activity level − Low activity level
Variable cost = Change in cost
Change in activity
Variable cost = $980 − $740
800 − 500
Variable cost = $240/300 or .80 for each dog groomed
We can now calculate the fixed cost component. We can use the total cost of either the high or the low and subtract the variable component:
Fixed cost = Total cost − Variable cost element
Fixed cost= $980 − .8(800) = $980 − $640 = $340 using the highest month
Fixed cost = $740 − .8(500) = $740 − $400= $340 using the lowest month
Note
This method can only be used if the scattergram that you used for your initial testing shows a linear correlation between the costs and the quantity! Also note that although this method is simple to apply it only uses the two points of data. Having only two points of data might produce results that are not accurate. Because of this, the next section on the least squares regression will probably be more useful and reliable for determining the fixed and variable portions of mixed costs.
Practice Questions
Least Squares Regression Method
This method uses all of the data available to separate the fixed and variable portions of a mixed cost. A regression line is fitted into the data using the following formula:
Y= a + bX
Y= Maintenance costs
X= Number of dogs groomed
a= the total fixed cost
b= the variable cost per unit of activity
So using a calculator available HERE.
If you use the data from the dog groomer example you should be able to calculate the following chart:
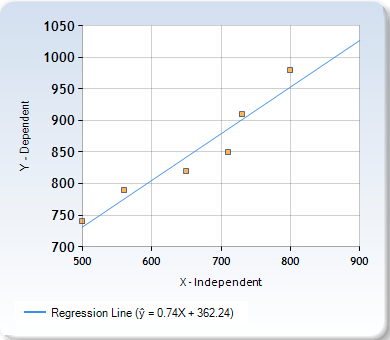
This method is more accurate, using all of the available data. The table below shows the difference in calculation using the two methods:
| Costs | High-low | Least Squares Regression Method |
|---|---|---|
| Variable cost estimate per dog groomed | $.080 | $.074 |
| Fixed cost estimate per month | $340 | $362.24 |